We're 100% independent
Find the top Canadian online casinos
Get the biggest welcome bonuses
We're 100% independent
Find the top Canadian online casinos
Get the biggest welcome bonuses
Major League Baseball is back, and before you hear the crack of a bat in person, you'll need to grab a ticket. The average nine-inning game will last around three hours, with an average of around 4.5 runs per game. Since baseball is (usually) not a high-scoring sport, there are other opportunities for action and excitement over the course of those nine innings, and you may wonder about the actual value of your ticket before you settle into your seat under the hot summer sun.
Hitting a long ball (or a home run, that is) is always an exciting event, but all 30 teams averaged just a tad over one homer per game in 2018, which leaves a lot of game time to manufacture runs and get fans on their feet. Small ball, when teams concentrate on getting runners on base and moving them over and in, can create some exciting moments as well, as they utilize speed, stolen bases, and clutch hitting to run up the scoreboard (such as in the eighth inning of the 2015 ALDS Game 4).
We decided to look at what a fan's return on investment (ROI) is when attending a baseball game, where each team ranks in the MLB in terms of ticket prices, and how much action fans can expect to see during a game.
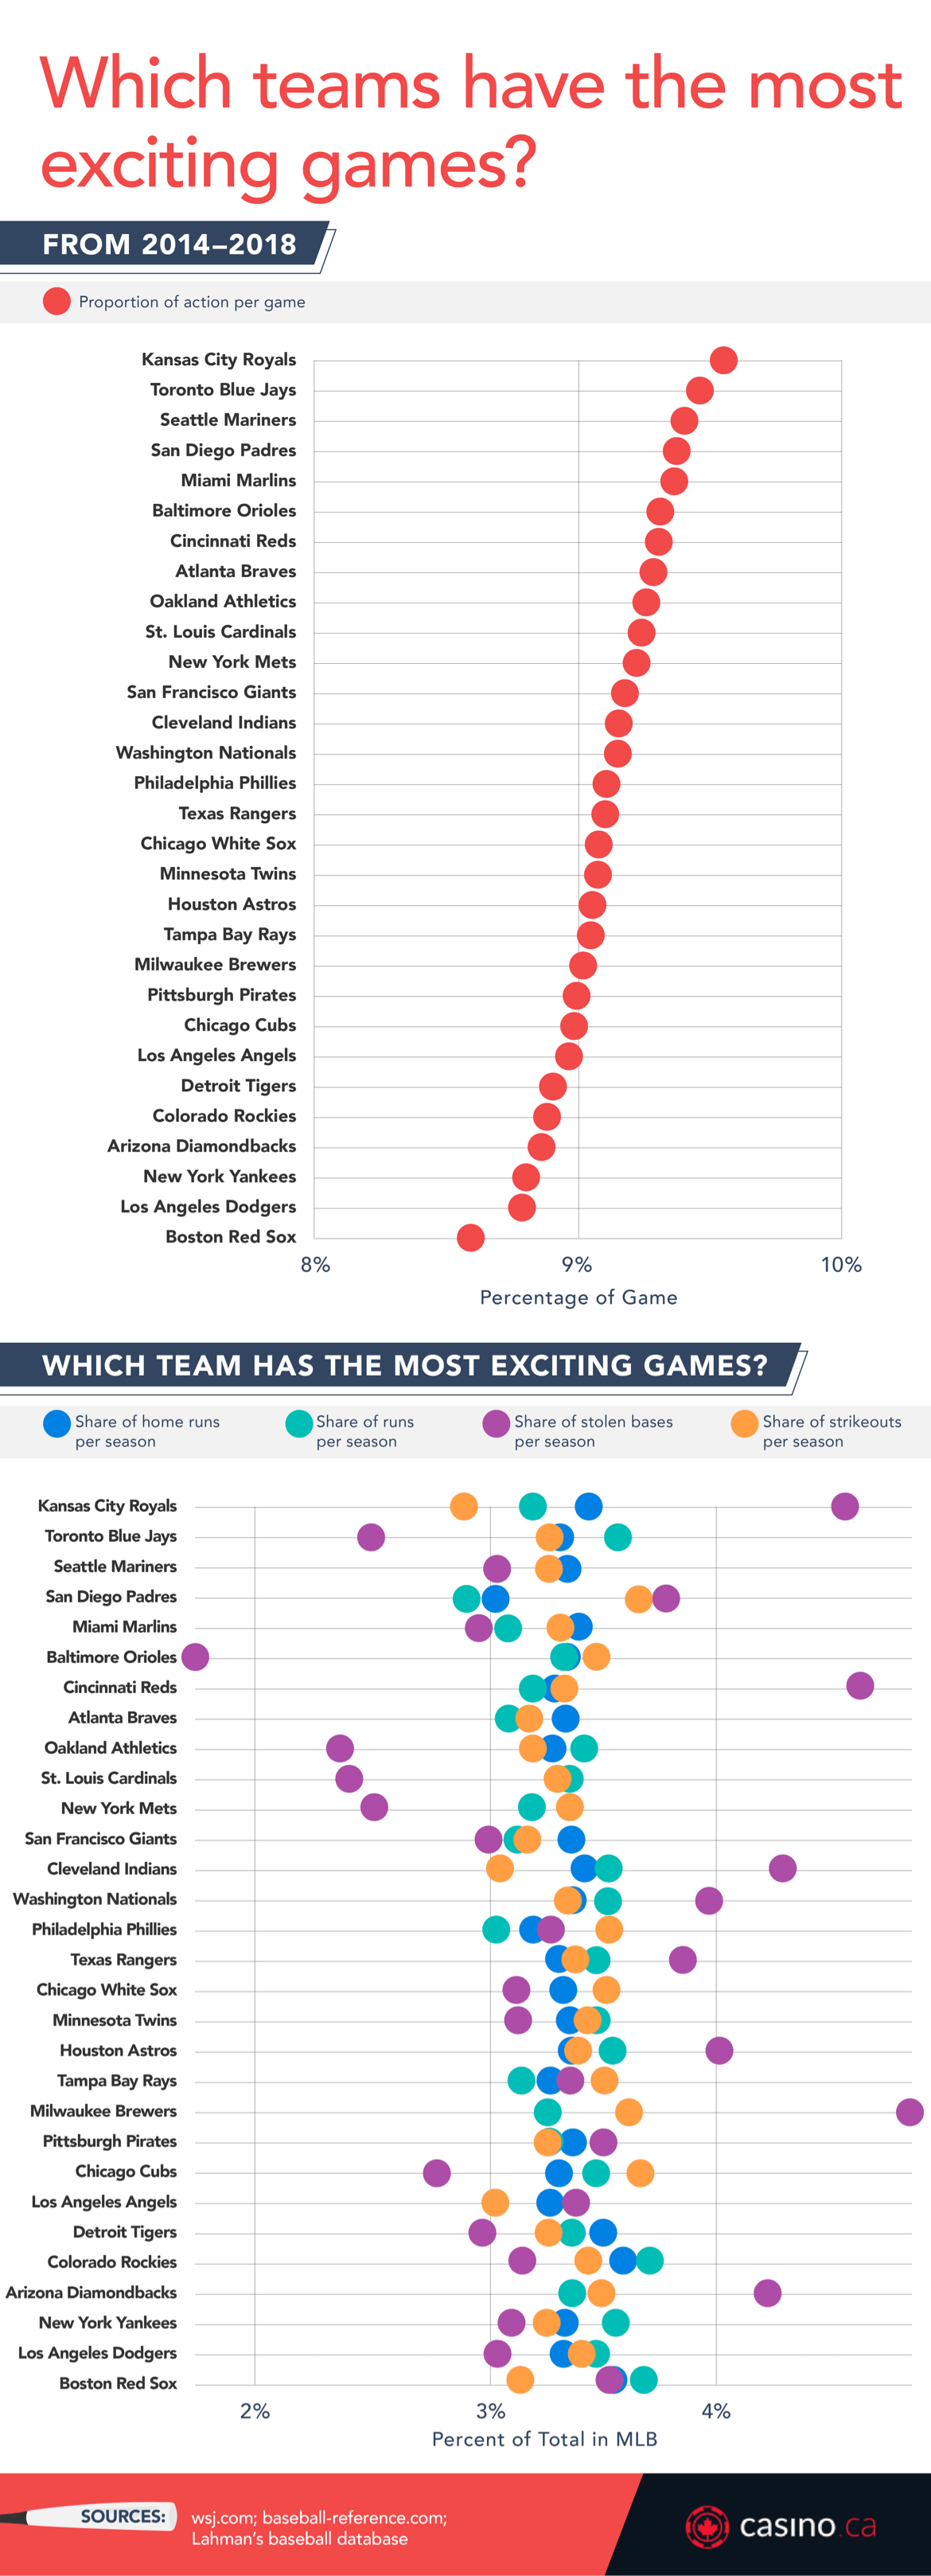
We looked at which team had the most exciting games from 2014 to 2018. The Kansas City Royals come in at the top spot here, their stats likely amplified during their two World Series runs in 2014 and 2015, as well as their recent success with stolen bases (117 in 2018, 45 of which were courtesy of Whit Merrifield who led the league in both stolen bases and hits).
The Royals are closely followed by the Toronto Blue Jays, who had a couple of playoff runs in 2015 and 2016 (falling in the ALCS both times), and the Seattle Mariners, who haven't had playoff appearances since 2001 but still have batted in a ton of runs (768 in 2016 alone).
At the other end of the spectrum, we find the Boston Red Sox. Yes, they won the World Series in 2018, but their overall stats were perfectly average, which keeps them down low in this aspect. The Los Angeles Dodgers are also pretty low in this regard, and while their stats weren't poor, they weren't exceptionally high, either.
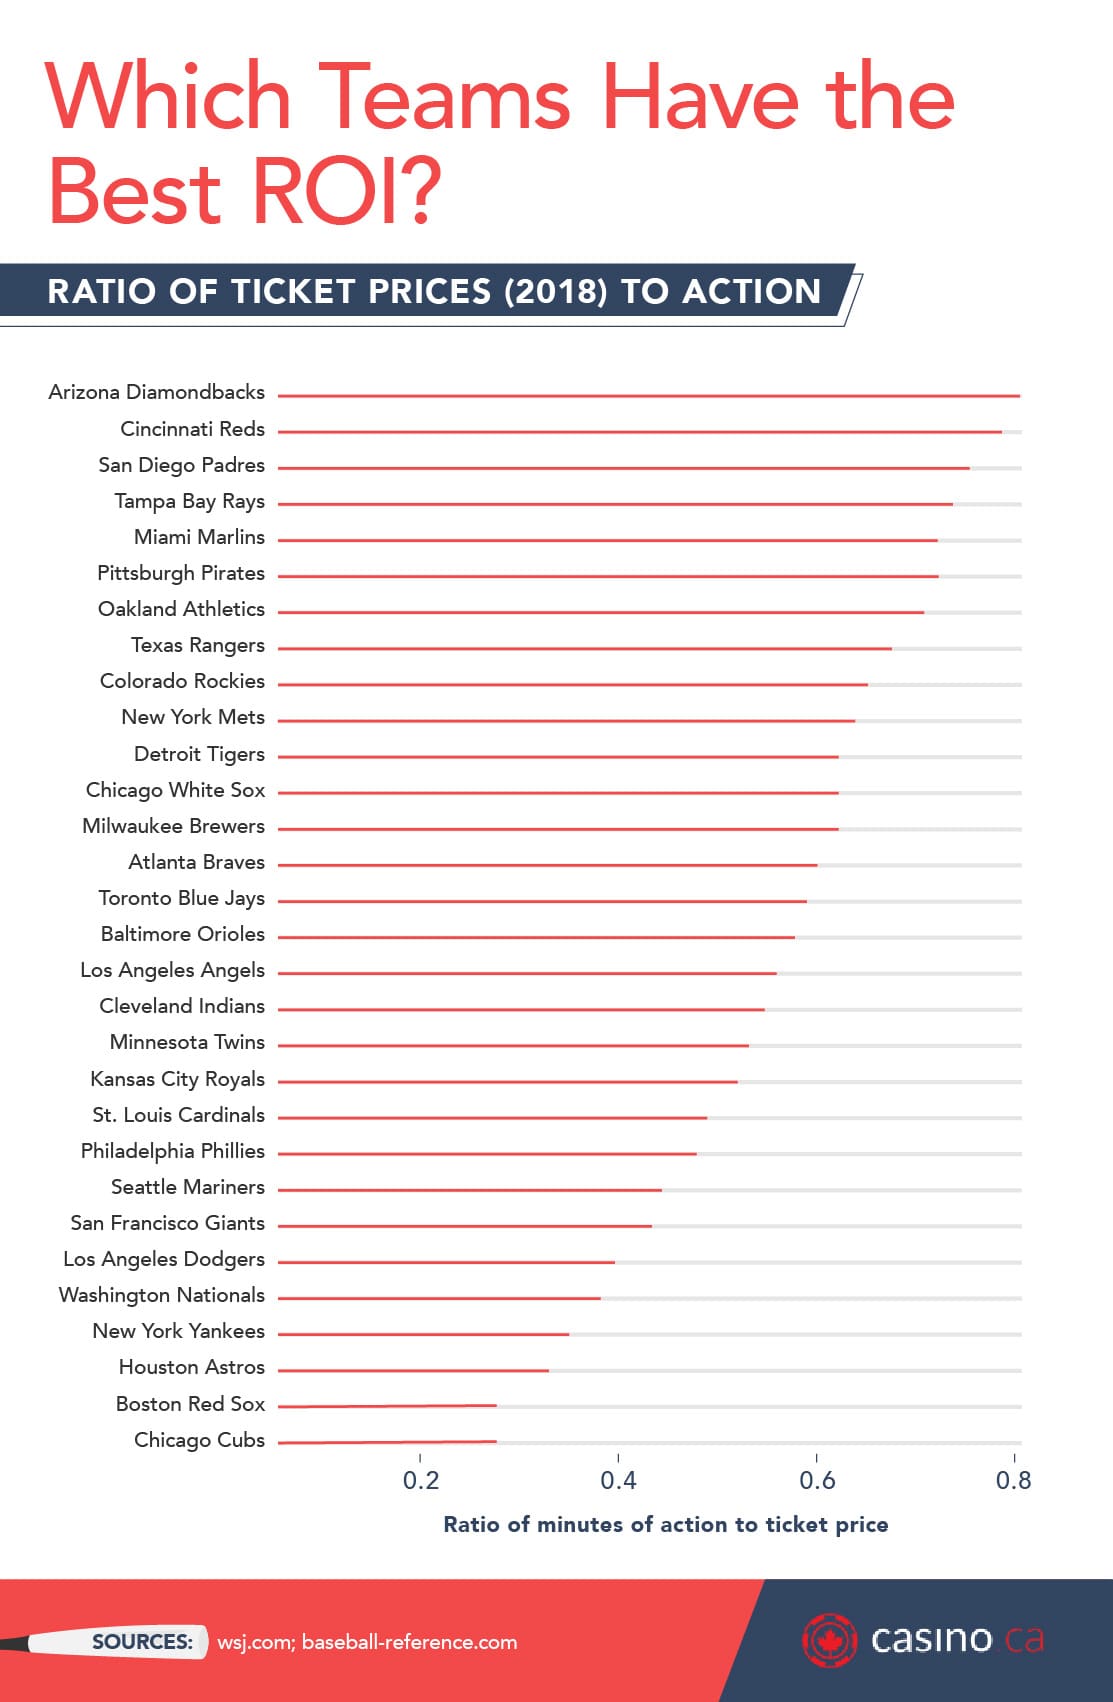
Here, we checked ticket prices from 2018 to see which teams have the best value per ticket (in other words, these teams provide the most minutes of action when compared to their ticket prices). The Arizona Diamondbacks had the highest ratio of action minutes compared to ticket prices, while Cubs fans found themselves on the other end of the spectrum with the least amount of action in relation to the ticket price.
The Diamondbacks are poised to take on the 2019 offseason with money in the bank after Zack Greinke's move to Houston, freeing up payroll to bring in rising stars and heavy hitters to add to the team's explosive gameplay. However, the Cubs have had a lot of recent success, including their first World Series win in over a century in 2016, indicating that fan attention may rise in the coming season.
Remember, though, that fan excitement doesn't stem from offense alone – pitching can be very satisfying to watch, especially those pitchers who are strikeout machines. While the Astros found themselves at the bottom value-wise, they had Gerrit Cole in their pitching rotation, who had the highest number of strikeouts per nine innings pitched. The Washington Nationals had a similarly low return on investment for their fans, but Max Scherzer was in their rotation, and he led the majors with 300 strikeouts for the whole season.
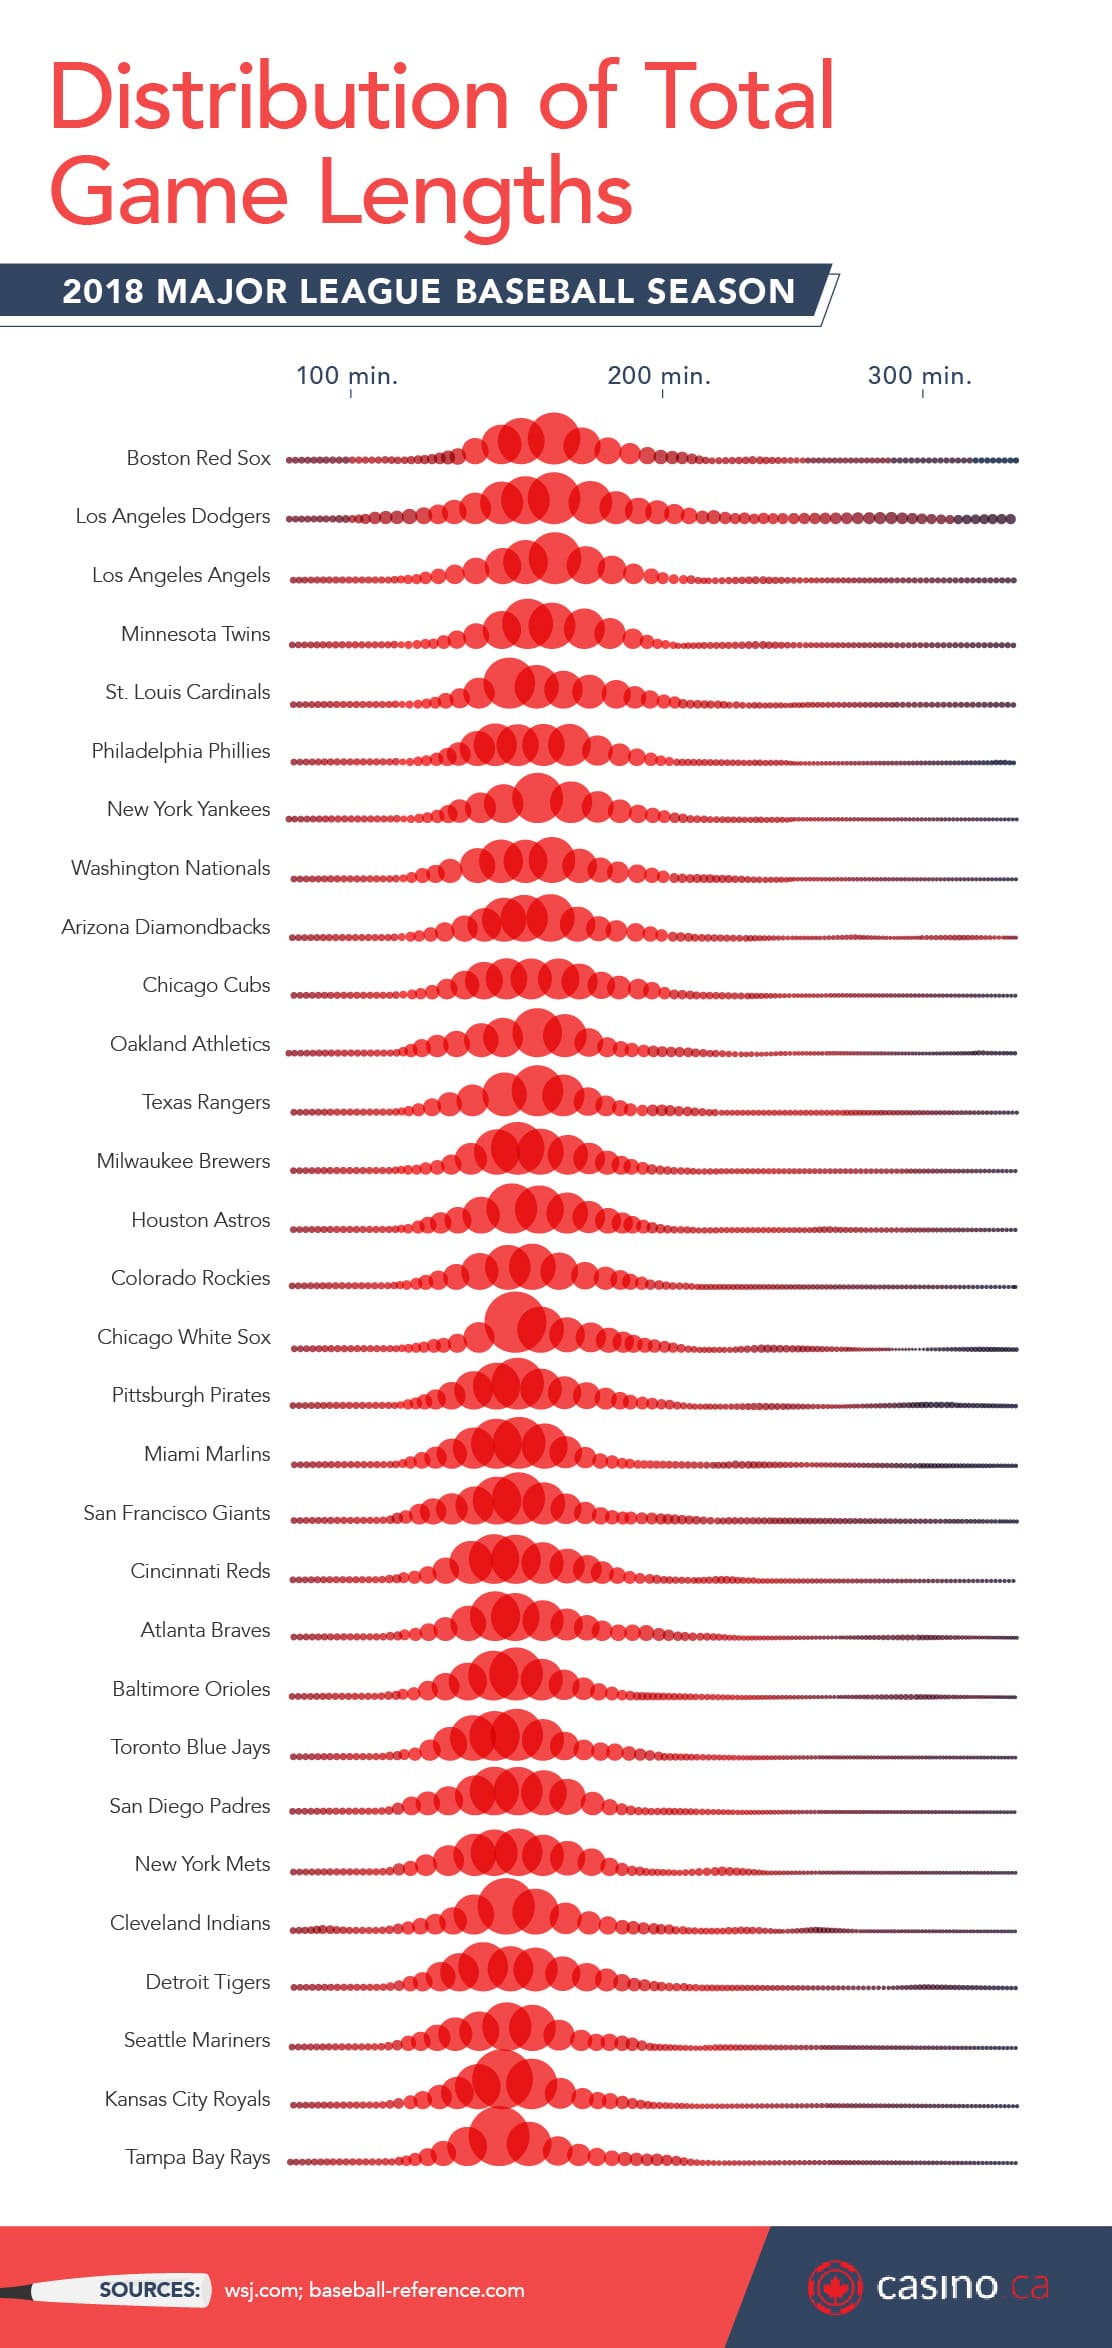
The average length of an MLB game has steadily increased each season. Back in the 1920s, the average time of a nine-inning game was just a tick over an hour and 45 minutes. This average then hit two hours in 1937, 2.5 hours in the mid-'50s, and two hours and 40 minutes in the mid-'80s. Now, games usually last around three hours, and as these modern-day games stretch on, that can dramatically decrease the value of a game from an action standpoint.
We broke down the average game time on a team-by-team basis and found that the Washington Nationals and the New York Mets tied for the longest average games in 2018, followed by the Royals, Dodgers, and Phillies.
Fans enjoyed shorter games in Detroit, though, where the Tigers had the shortest average games in the majors at two hours and 56 minutes per game, just edging out teams like the Pirates, Blue Jays, Rangers, and Padres, all with game times falling under three hours.
There have been ongoing efforts by the MLB to shorten baseball in hopes of boosting fan interest and making the games more competitive. Recent rule changes, including limiting the number of mound visits teams can make throughout a game, have helped whittle down game time, but other rules may be on the horizon. Will the MLB ever revert to games that last 2.5 hours (or less)? It's hard to imagine, but for those looking to add more action to the game and reduce downtime, it may be possible to shave off a few minutes here or there to accomplish that goal.
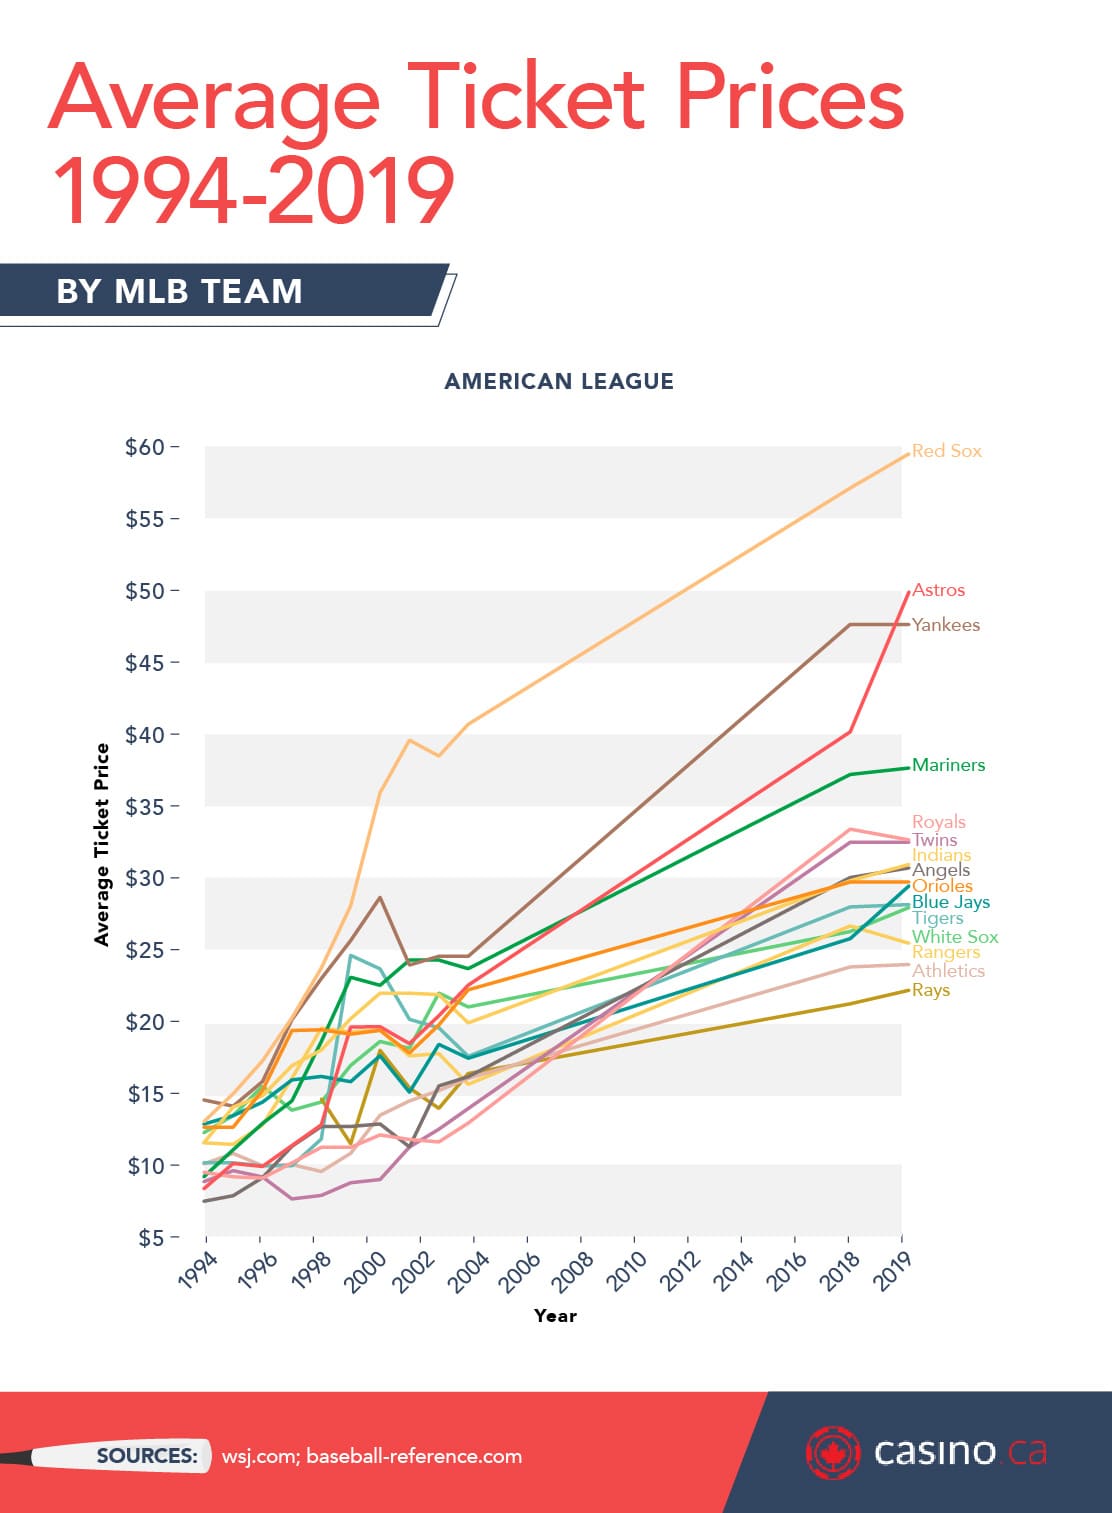
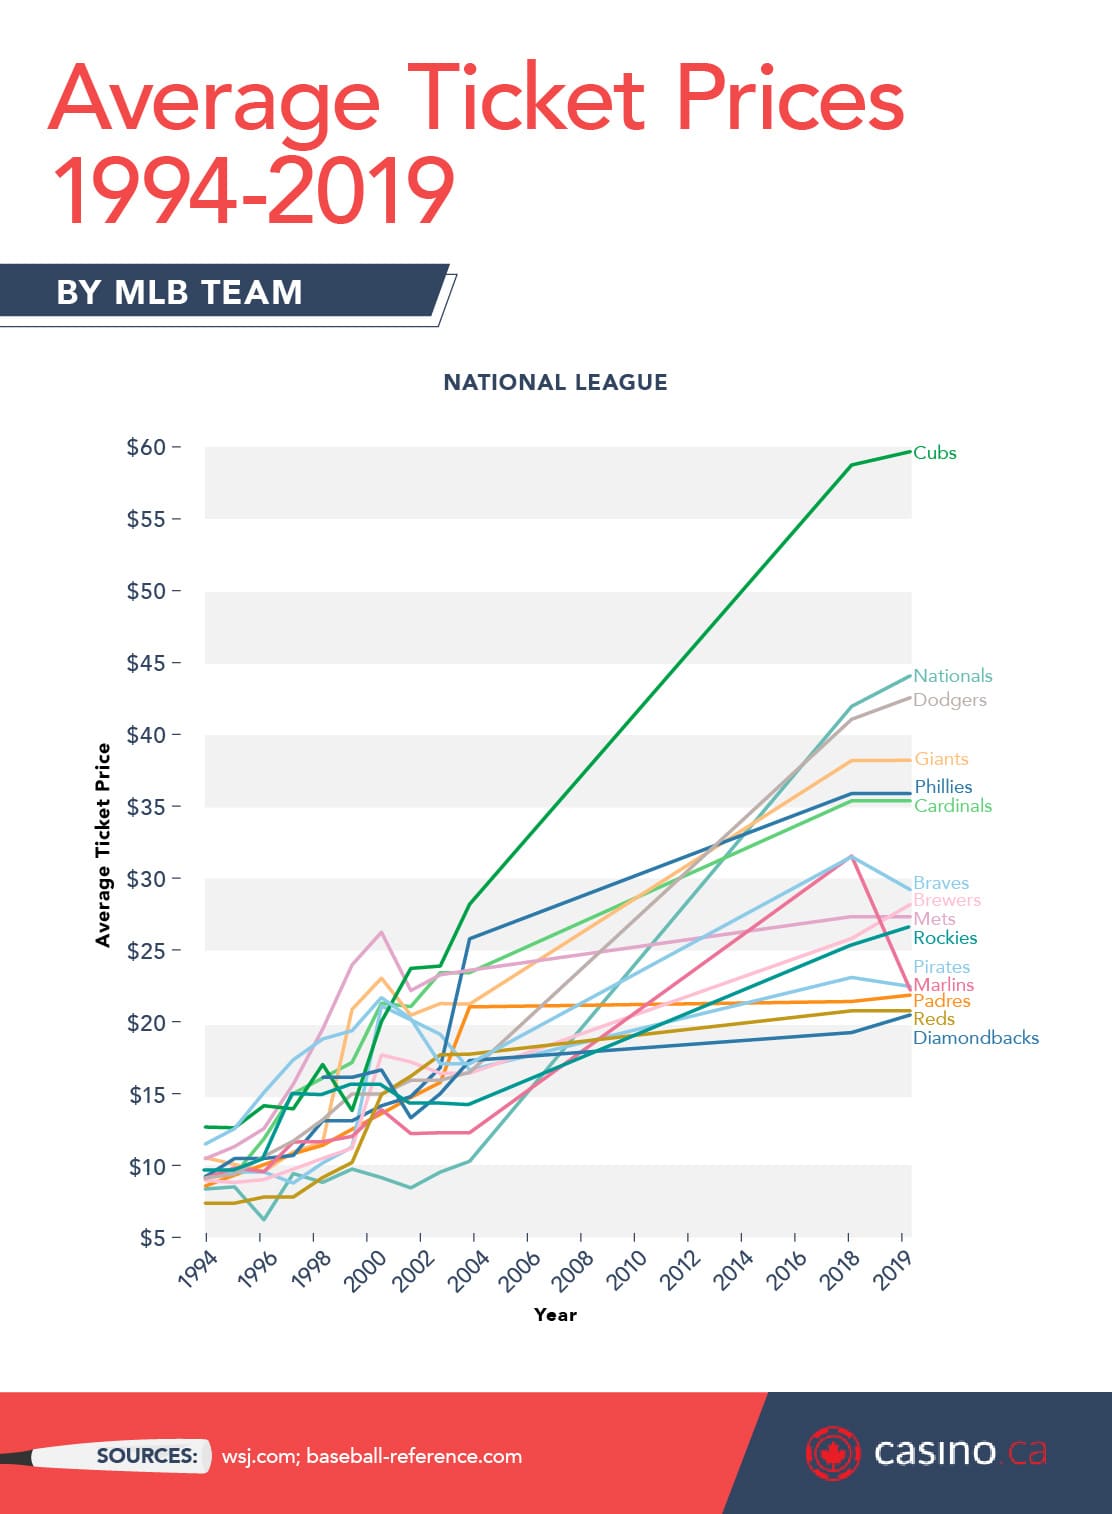
Ticket prices were pretty slow and steady for many years, starting to steadily increase as the 20th century drew to a close. Around 2000, ticket prices started to show a lot more variation between different teams. For example, in 1999, you could catch the Cards at Busch Stadium for around $16.50, but if you wanted to take in the Bronx Bombers, you'd have to fork out more than $23.
The Chicago Cubs pricing started to go sky high right after the turn of the century, and they remain one of the highest-priced games in the country (not a surprise, seeing how their FCI is the highest in the majors). Arizona, who entered as an expansion team in 1998, started low and remains low to this day – they've gone from $16.58 in 1999 to just a few dollars more in 2019 at $20.86 per ticket. Compare that to the Astros, who offered $13 tickets in 1999 and now offer them for nearly $50 in 2019.
It costs money to attend a baseball game, especially at the big league level, and even more so in large-market cities or for teams that have enjoyed recent success. While we can parse down the cost of a ticket to see which teams offer the most value for the money, attending a baseball game isn't just about the shutouts, the complete games, the no-hitters, the strikeouts, the stolen bases, the home runs, or even the grand slams. Yes, it's always more fun to go when your favorite team is winning, but being in a Major League Baseball stadium, under the sun or under the stars, watching one of your favorite pastimes unfold right in front of you can be, in some ways, priceless.
Initial data visualization and exploration were done in R, using the ggplot2 and dplyr packages. The map of ticket prices was created with leaflet and hosted as a shiny app. For data on lengths of action, we used Wall Street Journal studies from 2010 and 2013, accessed via the National Arms Race blog. Pricing data for the period 1950 to 2004 was scraped from Doug Pappas's Business of Baseball blog and price data for 2017 was scraped from UC Berkeley data science but was originally from Team Marketing Report, a service which is currently behind a paywall. We supplemented this with data from Baseball Reference, fetched via the baseballr R package, and from the Lahman baseball database, fetched via the Lahman R package.
Most of the data were programmatically manipulated via dplyr with work and data available on the Github repo. Since several teams have been introduced to the MLB or have changed their location and name since 1950, we updated latitude, longitude, and team names according to the Wikipedia Timeline of MLB History for the map of ticket prices.
We hope to make the ROI of reading our article high for readers, which is why you are free to use any of its images or editorial on your own page for noncommercial purposes. Please include a link back to this page so our authors can receive credit and maximize their own ROI on this work.