The Luckiest States and Cities in America for Lottery Wins
Whether it's a quick stop at the gas station or choosing the same lucky numbers every week, millions of Americans dream of landing the next life-changing lottery jackpot. And with National Lottery Day (July 17) just around the corner, it’s the perfect time to dream big.
But are some parts of America luckier than others?
To find out, we analyzed more than 132,000 winning Mega Millions and Powerball tickets sold across the US over the past two decades. By looking at where the biggest winning tickets were purchased, we ranked the states, cities and retailers with the highest-value lottery wins, revealing America's "luckiest" lottery locations based on historical jackpot data.
Key findings include:
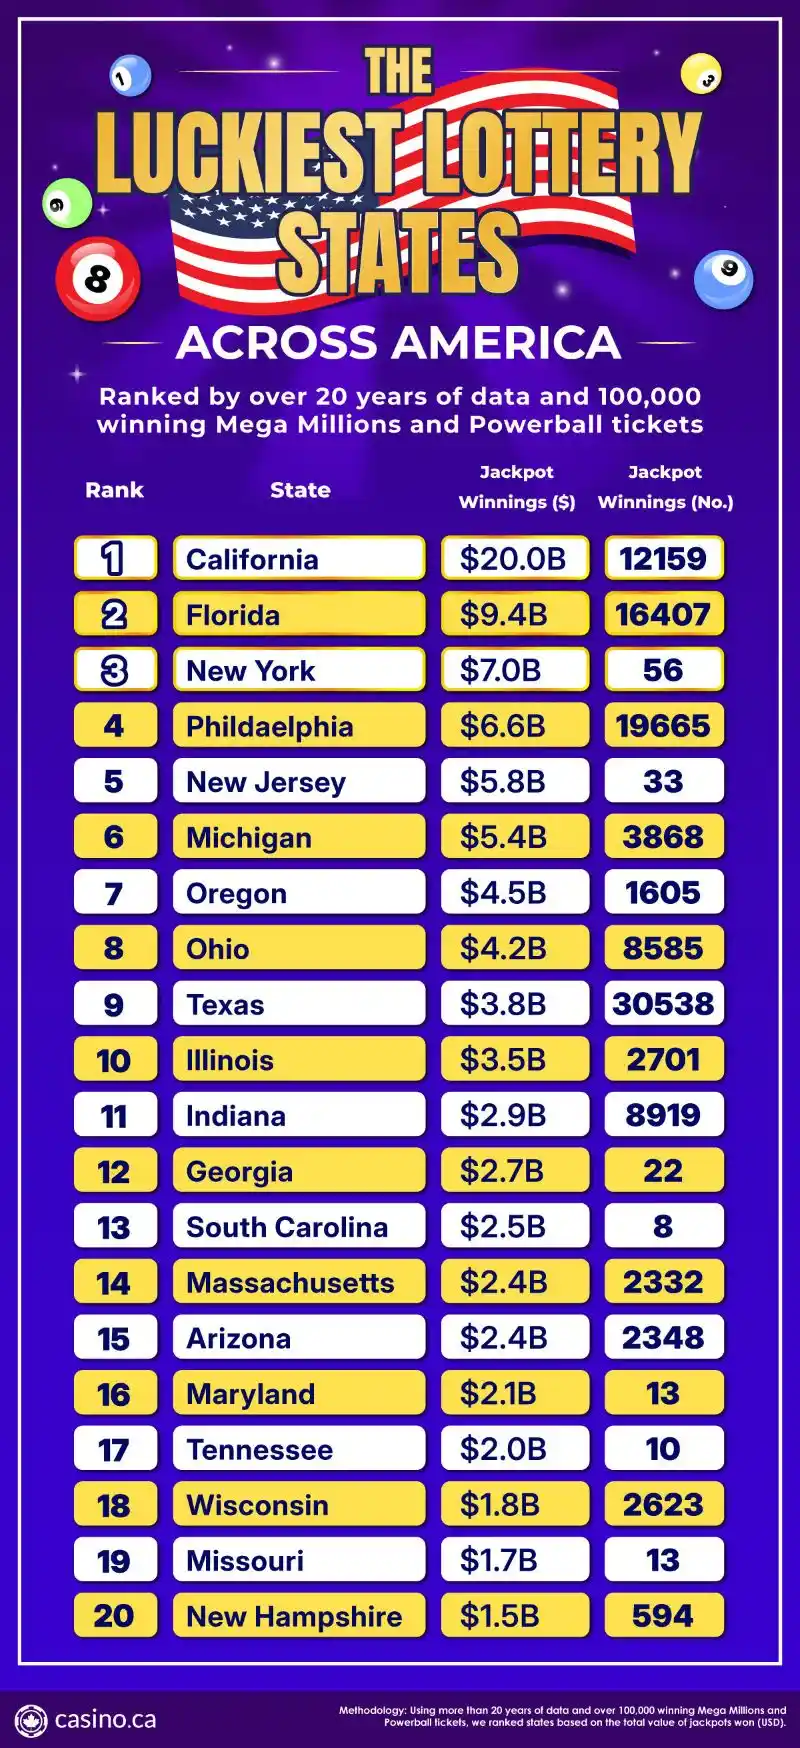
- California ranks as America's luckiest state, with more than $20.6 billion in Mega Millions and Powerball prize money won.
- Florida places second with $9.4 billion in total winnings, while New York rounds out the top three with $7 billion.
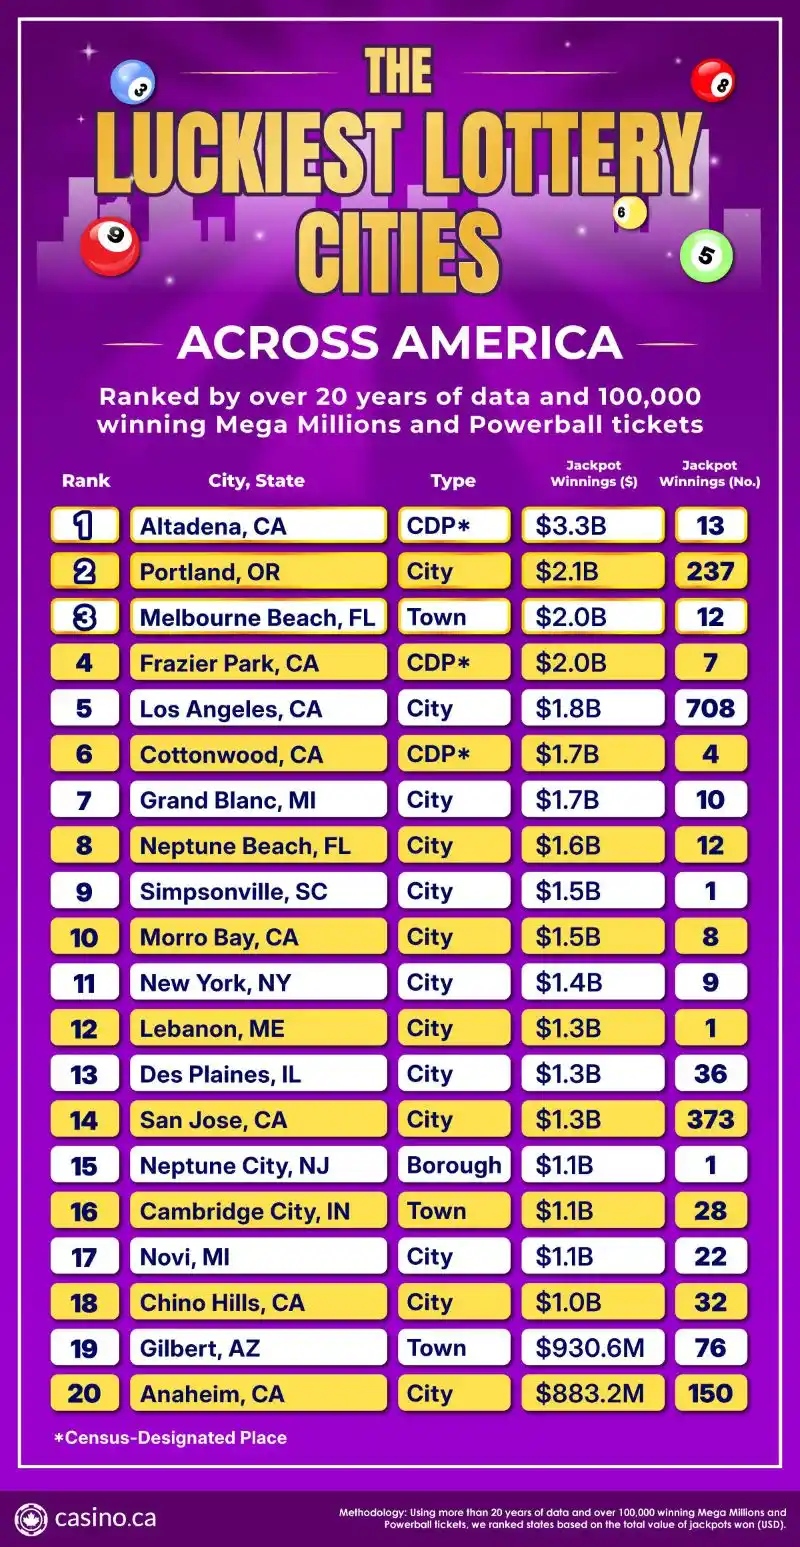
- Altadena, California, a census-designated place (CDP) with just over 43,000 residents, is America's luckiest community, generating more than $3.3 billion in lottery jackpots.
- Portland, Oregon and Melbourne Beach, Florida complete the top three luckiest communities. (Community rankings include cities, towns, villages, boroughs and census-designated places.)
- Midway, Hy-Vee Gas and Gateway Newstands rank as America's luckiest lottery retailers, based on the average value of jackpot-winning tickets sold.
Feeling lucky? These states have America's biggest winning history
When it comes to lottery luck, California is in a league of its own. Over the past two decades, the Golden State has produced more than $20.6 billion in Mega Millions and Powerball prize money across 12,159 winning tickets. Adjusted for population, that's the equivalent of $508 in winnings for every resident, making California the luckiest state in America based on historical jackpot data.
Despite having less than half of California's total jackpot value, Florida secures second place with an impressive $9.4 billion in winnings. Interestingly, the Sunshine State actually recorded more winning tickets than California, with 16,407 winning entries, equating to around $401 per resident. New York completes the top three, with $7 billion in prize money and approximately $351 per resident.
Rounding out the top five are Pennsylvania ($6.6 billion) and New Jersey ($5.8 billion), proving that lottery luck stretches right across the country.
Small town, big jackpot: America's luckiest communities
Lottery luck isn't reserved for America's biggest cities. For this ranking, we included cities, towns, villages, boroughs and census-designated places (CDPs), giving communities of every size the chance to make the list. The results reveal that some of the luckiest places in America are far smaller than you might expect.
Topping the rankings is Altadena, California, a census-designated place with a population of just over 43,000. Despite its modest size, the community has produced an incredible $3.3 billion in lottery jackpots from just 13 winning tickets over the past two decades. Portland, Oregon takes second place after selling 237 winning tickets worth a combined $2.1 billion, while Melbourne Beach, Florida ranks third with almost $2 billion in jackpot winnings from just 12 winning tickets.
California's lottery success doesn't end there either. Frazier Park and Los Angeles also feature in the top five, meaning three of America's five luckiest communities are located in the Golden State.
America's luckiest convenience chains
Whether it's a neighborhood convenience store, your local gas station or the supermarket around the corner, everyone has their favorite place to pick up a lottery ticket. While every ticket has exactly the same odds of winning, our analysis reveals which retailers have historically sold the highest-value winning tickets over the last 20 years.
Leading the rankings is Midway, with an average jackpot value of $38.8 million per winning ticket sold. Hy-Vee Gas follows in second place with an average of $30 million, while Gateway Newstands claims third at $18.4 million. Completing the top five are Giant ($14.4 million) and Break Time ($13.6 million), giving lottery players plenty of new "lucky" retailers to keep an eye on.
The street names behind America's biggest lottery wins
Could your street name have a lucky streak? To find out, we analyzed the locations of thousands of winning lottery tickets and grouped them by street name, revealing which names have appeared most frequently on stores selling winning tickets.
Broadway takes the crown as the luckiest street name in the whole of America. With 430 winning tickets generating $489 million in jackpot prizes. Main Street comes a close second, producing 878 winning tickets worth $485 million, while Market ranks third with 257 winning tickets and $447 million in jackpots. Rounding out the top five are Lincoln and Rockwood, showing that some of America's most common street names also have some of the richest lottery histories.
Expert commentary: Tim Chartier, Professor of Mathematics and Computer Science at Davidson College:
Tim shared his top tips when it comes to playing the lottery:
Choose random numbers - "Every ticket is equally likely to win. A ticket is just as likely to win today as it is tomorrow, regardless of what was drawn today. Many people do use favorite numbers and dates like birthdays or anniversaries. As such, if you won, you’d have to share the prize! So, picking random numbers doesn’t change the odds of winning but it does increase the odds of your being the only winner!"
Buying more tickets - "The enticing news is that you're now 100 times more likely to win! In fact, with 1,000 tickets, your chances increase a thousandfold. Yes, your odds have improved, but only slightly in the grand scheme. It’s still overwhelmingly improbable."
Lucky numbers - "Each number is equally likely to be drawn. So why do some numbers show up more often than others? Try rolling a die 30 times. Each outcome, 1 through 6, has the same chance. Yet, you're unlikely to get exactly five of each. That’s randomness at work: patterns emerge, but they don’t imply predictability."
Methodology
We submitted public records requests to participating state lottery authorities for historical Mega Millions and Powerball jackpot winner data by retailer location.
The dataset included retailer name, address, city, state, jackpot prize value, and the number of jackpot-winning tickets sold. In total, we analysed more than 132,000 winning tickets spanning over 20 years of lottery draws.
To identify America's luckiest retailers, communities and states, we grouped the data by retailer, city and state, ranking each by total jackpot prize value. For retailers, we also calculated the average jackpot value of winning tickets sold.
For this analysis, "city" includes cities, towns, villages, boroughs and census-designated places (CDPs), ensuring communities of all sizes were represented.
Data collected June 2026.
For media enquiries, please contact: admin@casino.ca
Fair Use
Feel free to use the data or visuals on this page for non-commercial purposes. Please be sure to include proper attribution linking back to this page to give credit to the authors.
 We are 100% independent